Purpose:
The primary purpose of this laboratory experiment is to
determine the value of Plank’s constant using only a couple of LED lights with varying
color. The lights will be turned down to as little a voltage as possible just
so that the light is barely visible. After the voltage is found, the wavelength
will need to be determined in order to determine the value of planks constant.
Procedure:
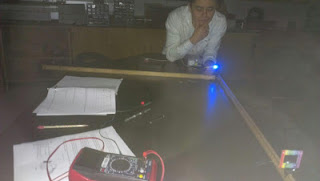
First, the LED lights were distributed so that each group
received red, green, blue, and yellow colored lights. These were then attached
to a power supply and a resistor box. Once that was set up, the resistance
across the circuit was increased to the point at which the light was barely
visible in the casing.
Once this was done, the voltage across the circuit was
measured and recorded for a later calculation. This process was repeated for
the remaining colors. Next, the lights were shined to a visible level and allowed
to be beamed through a gradient.
Similar to previous setups, the light was
placed a distance “l” away from the observing gradient and another meter stick
was placed perpendicular to the length so as to measure the distance away from
the light source, “x”, that the spectrum lines were placed.
This was done to
achieve the wavelength. Once the line was found, it was marked and recorded to
compute the necessary calculations at a later time. This process was repeated
for the rest of the colors that were obtained.
Data Analysis:
The following table contains the recorded voltage reading
across the colored LEDs while the light was barely shining.
|
Color
|
Voltage (V)
|
|
Red
|
1.56
|
|
Green
|
1.87
|
|
Blue
|
2.25
|
|
Yellow
|
1.63
|
These numbers will be
used at a later time, after the wavelengths are calculated.
The next table displays
the recorded information obtained from the viewing of the lights through the
gradient.
|
Color
|
l (cm)
|
x (cm)
|
λ
(nm)
|
|
Red
|
90 ± 1
|
32 ± 1
|
673 ±20
|
|
Green
|
90 ± 1
|
28 ± 1
|
551 ±15
|
|
Blue
|
90 ± 1
|
25.8 ± 1
|
485 ±14
|
|
Yellow
|
90 ± 1
|
22.5 ± 1
|
594 ±14
|
The following shows the
derivation of finding lambda:
λ/d = x/(x2+l2)1/2
λ = dx/(x2+l2)1.2
Once the wavelength was
determined for each light, Plank’s constant can then be found using the following
equation:
E=hc/λ=qV
h = qVλ/c
the following table
depicts the calculated constants that are associated with the color:
|
Color
|
Value of h
|
|
Red
|
5.57 * 10-34
|
|
Green
|
5.50 * 10-34
|
|
Blue
|
5.82 * 10-34
|
|
Yellow
|
5.20* 10-34
|
The last chart
pictured, displays the percent errors of each calculated value to the accepted
value of Plank’s constant.
|
Color
|
Percent Error
|
|
Red
|
15.9%
|
|
Green
|
17.0%
|
|
Blue
|
12.1%
|
|
Yellow
|
21.5%
|
Conclusion:
Although the theory was there, the results did not manage
to produce the value of Plank’s constant to within a reasonable degree of
error. This may have been as a result of an inaccurately measured voltage
across the LED while the light was being viewed. The light continued to be seen
even when the resistivity was turned extremely high. This led to a large
uncertainty in the determination of the minimum voltage across the LED and thus
led to an inaccurate calculation of the constant. Another source of error could
have resulted from the measurement of the spectrum lines with the diffraction gradient.
The lines were hard to see and may have led to a not so accurate measurement of
x value. Given better conditions, it seems very likely that the value of Plank’s
constant could me accurately measured by simply using a LED.


