Thursday, November 29, 2012

Plank's Constant From An LED


Purpose:

            The primary purpose of this laboratory experiment is to determine the value of Plank’s constant using only a couple of LED lights with varying color. The lights will be turned down to as little a voltage as possible just so that the light is barely visible. After the voltage is found, the wavelength will need to be determined in order to determine the value of planks constant.

Procedure:
           
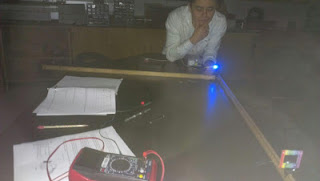
            First, the LED lights were distributed so that each group received red, green, blue, and yellow colored lights. These were then attached to a power supply and a resistor box. Once that was set up, the resistance across the circuit was increased to the point at which the light was barely visible in the casing. 


Once this was done, the voltage across the circuit was measured and recorded for a later calculation. This process was repeated for the remaining colors. Next, the lights were shined to a visible level and allowed to be beamed through a gradient.


 Similar to previous setups, the light was placed a distance “l” away from the observing gradient and another meter stick was placed perpendicular to the length so as to measure the distance away from the light source, “x”, that the spectrum lines were placed. 


This was done to achieve the wavelength. Once the line was found, it was marked and recorded to compute the necessary calculations at a later time. This process was repeated for the rest of the colors that were obtained.

Data Analysis:

            The following table contains the recorded voltage reading across the colored LEDs while the light was barely shining.
Color
Voltage (V)
Red
1.56
Green
1.87
Blue
2.25
Yellow
1.63
These numbers will be used at a later time, after the wavelengths are calculated.

The next table displays the recorded information obtained from the viewing of the lights through the gradient.
Color
l (cm)
x (cm)
λ (nm)
Red
90 ± 1
32 ± 1
673 ±20
Green
90 ± 1
28 ± 1
551 ±15
Blue
90 ± 1
25.8 ± 1
485 ±14
Yellow
90 ± 1
22.5 ± 1
594 ±14
The following shows the derivation of finding lambda:

λ/d = x/(x2+l2)1/2
λ = dx/(x2+l2)1.2

Once the wavelength was determined for each light, Plank’s constant can then be found using the following equation:
E=hc/λ=qV
h = qVλ/c

the following table depicts the calculated constants that are associated with the color:

Color
Value of h
Red
5.57 * 10-34
Green
5.50 * 10-34
Blue
5.82 * 10-34
Yellow
5.20* 10-34

The last chart pictured, displays the percent errors of each calculated value to the accepted value of Plank’s constant.

Color
Percent Error
Red
15.9%
Green
17.0%
Blue
12.1%
Yellow
21.5%


Conclusion:

            Although the theory was there, the results did not manage to produce the value of Plank’s constant to within a reasonable degree of error. This may have been as a result of an inaccurately measured voltage across the LED while the light was being viewed. The light continued to be seen even when the resistivity was turned extremely high. This led to a large uncertainty in the determination of the minimum voltage across the LED and thus led to an inaccurate calculation of the constant. Another source of error could have resulted from the measurement of the spectrum lines with the diffraction gradient. The lines were hard to see and may have led to a not so accurate measurement of x value. Given better conditions, it seems very likely that the value of Plank’s constant could me accurately measured by simply using a LED.
Wednesday, November 28, 2012

The Laser!!!!!

Purpose:

             The main objective of this laboratory experiment is to learn more in depth about the inside workings of a laser. This activity will use the online program of ActivPhysics to create an application that will allow the inside workings of a laser to be changed and adjusted to determine experimentally how the changes of the inside molecules affect the functional of the laser. This applet will allow us to discover more about the properties of spontaneous and stimulated emission.

Data Analysis:

            The following questions are the questions that were asked during the use of the program’s applet:

Question 1: Absorption
At any given time, the number of photons inputted into the cavity must be equal to the number that have passed through the cavity without exciting an atom plus the number still in the cavity plus the number of excited atoms. Verify this conservation law by stopping the simulation and counting photons.

-          This conservation is in fact verified through the running of the program. As the picture indicates bellow, at a random time, the number of photons inputted equals the number of photons passed while not exciting an atom plus the number of photons still in the cavity and those of the excited electrons. 


Question 2: Direction of Spontaneous Emission
During spontaneous emission, does there appear to be a preferred direction in which the photons are emitted?

-          No, the photons are not generated in a specific direction. The photons emitted by spontaneous emission propagate outwards into a random direction at a random time. 


Question 3: Lifetime of Excited State
Does there appear to be a constant amount of time in which an atom remains in its excited state?

-          No, there does not appear to be a constant time in which the atoms remain in an excited state. The atoms emit at random times and in random locations with no parameters that are noticeable to restrain them. 

Question 4: Stimulated Emission
Carefully describe what happens when a photon interacts with an excited atom. Pay careful attention to the phase and direction of the subsequent photons. (Can you see why this is called stimulated emission?)

-          When a photon hits an excited atom, that atom emits a photon. The previous photon that interacted with the atom initially, does not get absorbed and appears to be unaffected by the interaction. After the interaction, there is a total of two photons now that are both traveling in the same direction and phase as the originally present photon. 


Question 5: Pumping
Approximately what pumping level is required to achieve a population inversion? Remember, a population inversion is when the number of atoms in the excited state is at least as great as the number of atoms in the ground state.

-          The approximate pumping level appears to be present at around 90.


Question 6: Photon Emission
Although most photons are emitted toward the right in the simulation, occasionally one is emitted in another direction. Are the photons emitted at odd directions the result of stimulated or spontaneous emission?

-          These emitted photons must be as a result of spontaneous emission since the stimulated emission photons always appear to travel in the same direction of the entered photon. 


Conclusion:
            From this activity, it has been made more physical sense as to what quantum properties play a role in the production of an efficient laser. The gas that fills the interior of the laser must be set under very specific conditions for the laser to work properly. The gas must contain atoms that are in an excited state so as to increase the intensity of the beam. Another requirement is that the gas must contain a population inversion. Lastly, the photons that are being pumped into the laser’s gas chamber must be pumped at a specific rate so that the ratio of the atoms in an excited state to the atoms in a ground state remains relatively constant.

Color & Spectra


Purpose:

            The purpose of this laboratory experiment is to explore the emission and absorption properties of white light as well as different emissions and absorptions of other sources that contain only one type of element. The spectra lines will be viewed through a diffracting gradient and then marked to perform the necessary calculations. Once this is done with white light, it will then be repeated with hydrogen to compare the two observations. After that, an unknown gas will be viewed and identified using an absorption chart found online to determine the identity of the unknown.

Procedure:

            The first step that was done this experiment was the light source was obtained and placed in front of the defrating gradient. The distance of this gap was recorded.

The light source was then turned on and the spectra was viewed through the gradient. Once the spectra was found, the middle of each primary color was marked and the distance from that point to the light source was measured and recorded.

Once this was completed, all the tabulated data was stored to be used to calculate the wavelength at a later time. Once all the necessary recordable data for the white light was obtained, the hydrogen atom emitting light was then placed in front of the gradient to have the process repeated.

Again, as done previously with the white light, the spectra of the hydrogen light was observed and the observable spectrum lines were located and measured from the light source.

The same procedure was followed as before for the white light. Next, the unknown gas light was received and placed using the exact same set up as for the previously two light sources.

Again, the spectra was viewed and measured to make the necessary calculations later on in the experiment.


Data Analysis:
            The following table represents the observed data as well as the calculated and known wavelength of the different colors in white light. In the chart, l represents the distance from the light source to the gradient, x is the distance from the light source to the spectra line, d is the spacing between the gradient, and the last two coulombs represent the experimentally calculated wavelength and theoretical wavelength respectfully.    
Color
l (cm)
x (cm)
d (cm)
Exp λ (nm)
Act λ (nm)
Red
190 ± 1
73.0 ±1
.0002
717 ±17
750
Yellow
190 ± 1
53.5 ±1
.0002
542 ±23
570
Green
190 ± 1
48.5 ±1
.0002
495 ±23
510
Blue
190 ± 1
45.0 ±1
.0002
461 ±23
475
Violet
190 ± 1
37.0 ±1
.0002
382 ±22
390

The proceeding table contains the information gathered from the hydrogen spectrum. Again as before, the same variables from the previous table, represent the same values as before. 
Color
l (cm)
x (cm)
d (cm)
Exp λ (nm)
Act λ (nm)
Red
190  ± 1
67.0 ±1
.0002
675 ±23
656
Blue
190  ± 1
48.3 ±1
.0002
490 ±23
486
violet
190  ± 1
43.0 ±1
.0002
441 ±22
434

The last table below is the table that contains all the data recorded for the unknown gas that was given and analyzed. Again as before, the same variables in the table represent the same measurements as the formal tables. However since this is an unknown gas, the actual wavelength section of the table is not included. 
Color
l (cm)
x (cm)
d (cm)
Exp λ (nm)
Red
190 ±1
59.5 ±1
.0002
597 ±23
Orange
190 ±1
58.5 ±1
.0002
588 ±20
Yellow
190 ±1
56.0 ±1
.0002
565 ±21
Blue
190 ±1
49.0 ±1
.0002
499 ±23

After all of these calculations were made, the spectrum of a number of gasses was displayed and the gas that closely matched the above data was chosen to be determined as our unknown. In this case, our unknown gas was accurately guessed to be mercury. The actual wavelength of the emitted lights is listed below. 
Color
Act λ (nm)
Red
623.4
Orange
615.2
Yellow
577.0
Blue
502.5

Using the data now known, we were able to determine the measurements of the uncertainty of our measurements which follows:


Conclusion:

           From this experiment, we were able to determine the identity of an unknown gas by simply using the viewable spectra of the gas. This is because every element has its own unique emission spectra as well as absorption spectra. As long as the elements spectrum is known, the identity of an unidentified element can be accurately determined by using its spectra and comparing it to that of other elements. This procedure can be repeated and executed to a relatively accurate degree of uncertainty.